Recently, Heng Li released MiniBWA (GitHub) alongside a paper by Heng Li and Nils Homer describing the method (paper). MiniBWA builds on the approaches in Minimap2 (also by Heng Li), but falls back on approaches from BWA to manage certain cases that were time-consuming in the Minimap2 approach, but without sufficient benefit. In my opinion, these prior cases prevented Minimap2 from being strictly preferable relative to BWA MEM, but the approach in MiniBWA seems to manage all of the prior cases of concern.
The manuscript indicates that MiniBWA is 2-4x faster than BWA, with a high degrees of mapping concordance (with differences being mostly in non-analyzable parts of the genome). Variant calling benchmarks with HG002, downstream variant calling with MiniBWA is more accurate.
Heng recommends moving to MiniBWA for short read mapping.
The task of aligning short reads, which both BWA and MiniBWA perform, sits at the base of the majority of genomic workflows. I suspect that BWA has processed more bases than any other method ever written, outside of the instrument basecalling. So a recommendation to update to a new method is a big deal.
I was naturally very excited about the new method, and decided to take it across a diverse set of sequences to map. Since the paper analyzes human data thoroughly, I’m going to look at mapping to 76 different species with data taken off of SRA. For all of these individuals, I also have PacBio data, so we can look at speed to map the genome, mapping concordance, and accuracy against the highly mappable, highly accurate long read mapping and variant calling. I’ll detail those analyses in this blog.
The short conclusion is:
- MiniBWA is always much faster than BWA
- MiniBWA is highly concordant with BWA, except in very difficult species
- In those difficult cases, MiniBWA is in my opinion preferable.
Based on what I see, MiniBWA is a worthy successor to BWA MEM. If you are using a short read mapper to a linear reference genome, it is well worth your time to validate and switch to.
Assessing Speed
To assess speed, I took Illumina FASTQ reads for 76 different species along with their reference genomes from SRA. To test an extreme case, one of the genomes is wheat, a hard to map hexaploid 14.6 gigabase genome (~4.8 times the size of the human reference).
For each species, I made a set of 1 million (1M) reads and a set of 100k reads. For each species, I ran 5 replicates of the 1M and the 100k reads. I took the median runtime of each, and then I used the 100k read file as means to subtract index loading time from the time calculation (1 + x) = 10 * (0.1 + x) where x is the index load time, to calculate the median time to process. For this, I ran the program with 32 threads.
I did this operation for MiniBWA, BWA MEM, and Bowtie2. The plot below shows the mapping throughput of each relative to each other.
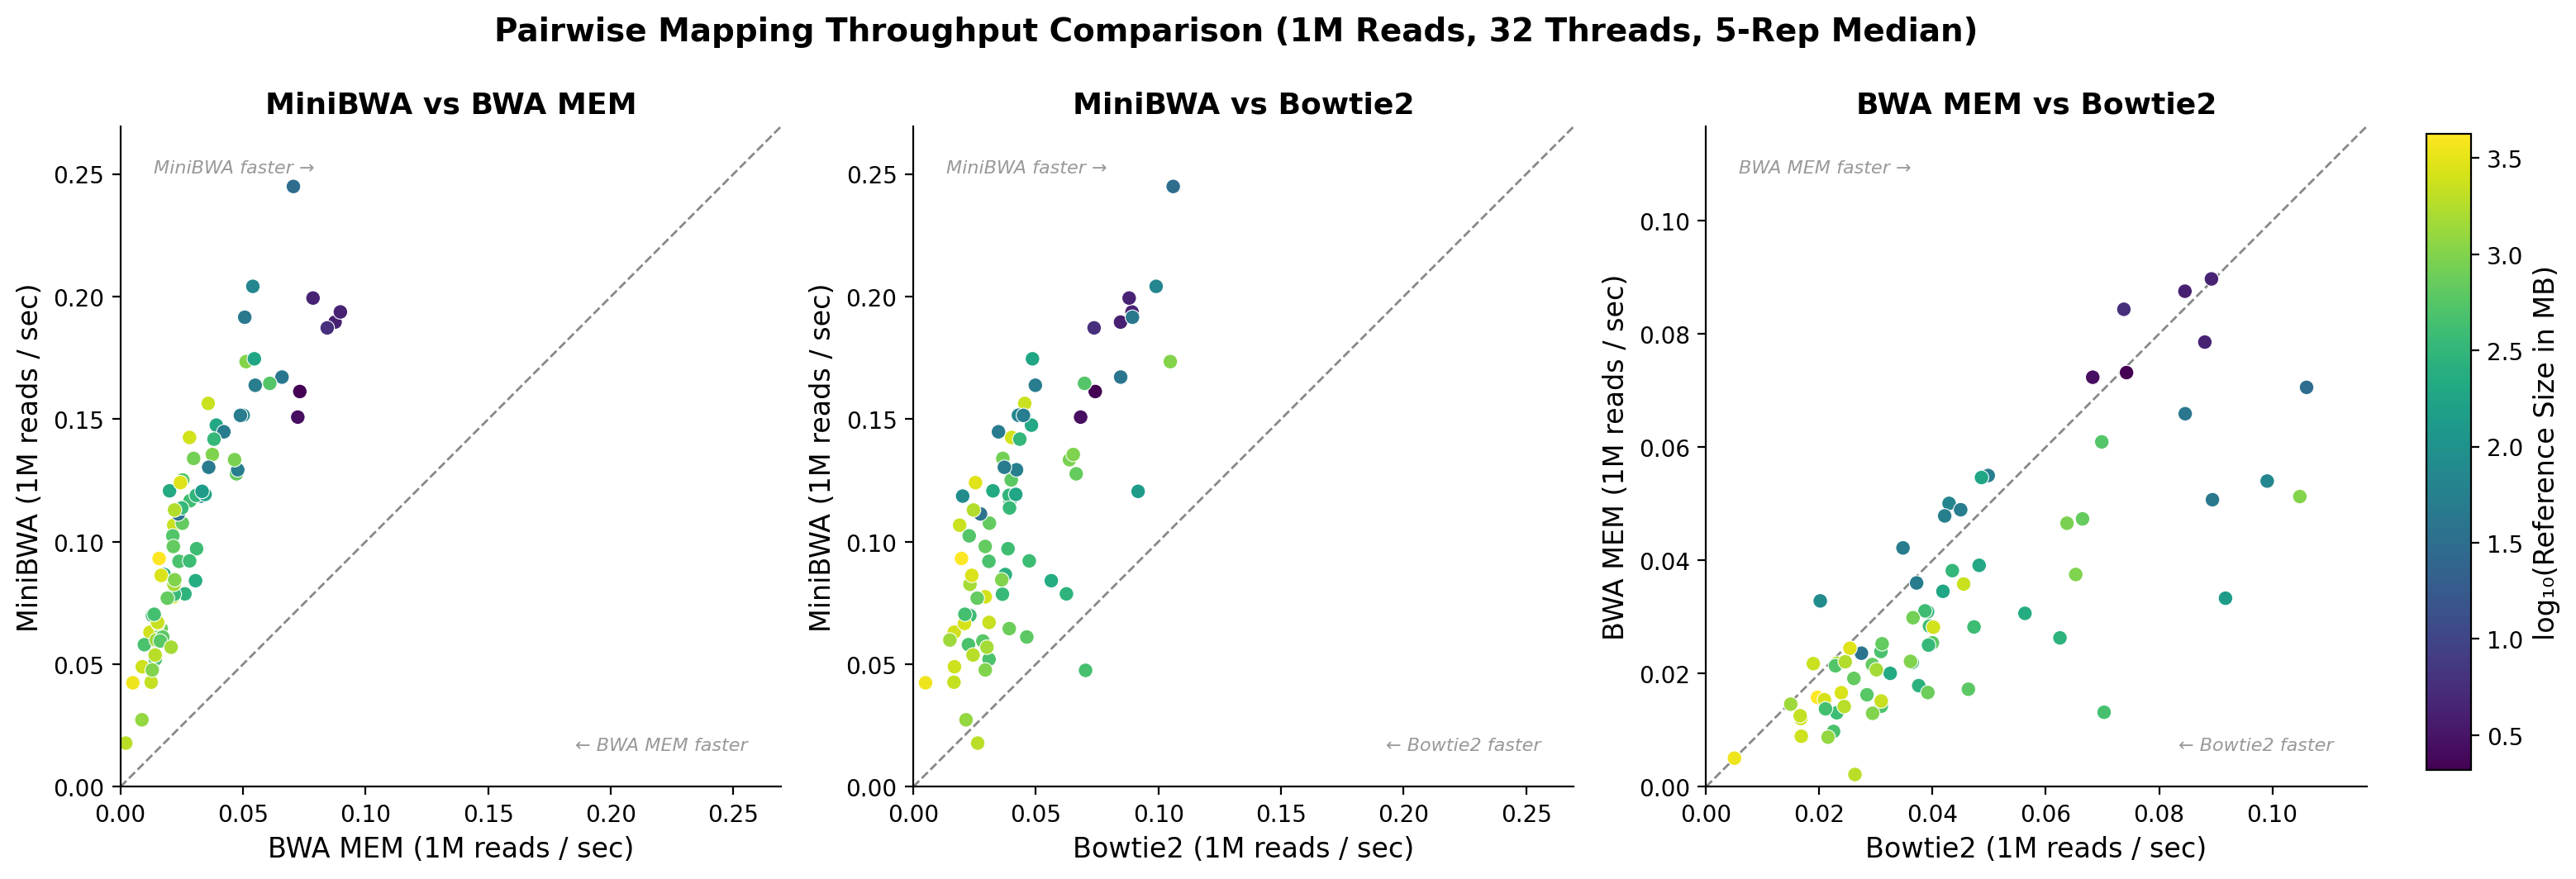
Figure 1. Mapping throughput of MiniBWA, BWA MEM, and Bowtie2 relative to each other. Each dot represents reads from a single species. The color indicates the size of the reference genome (to include the wheat genome in the color scale, I just set it to the max value for the 2nd largest genome. With color scaling, it makes everything become purple/blue if included directly).
As the chart indicates, MiniBWA is much faster than both BWA MEM and Bowtie2. Universally, mapping rates are higher on small references and lower on larger ones. All of the data points for MiniBWA are above the y=x line relative to BWA MEM. It is strictly faster on every sample.
Assessing CPU scaling
Next I looked at how MiniBWA scales with additional core resources. Here, I took a full genome sequence of Oryza sativa, and mapped it with MiniBWA, BWA MEM, and Bowtie2 at different numbers of cores.
Each of these programs was run piping the output into samtools sort, which is in my experience the fastest way to generate output:
./minibwa map -t ${THREADS} ${REF} ${R1} ${R2} | samtools sort -@ 4 -o "${BAM}"
One of the things which is immediately obvious is how much faster MiniBWA is relative to BWA MEM. It is universally faster across every core count. However, I also noticed that its scaling with cores is more sub-linear than BWA MEM. That is, it gets less relative benefit of more cores. That seems to be because MiniBWA is so fast that other components become the bottleneck, mainly the samtools sort operation, but potentially also disk I/O (my tests use a SSD-backed machine).
I observed better scaling when re-allocating more cores to the sort operation at a higher total number for cores (so 16 sort threads at a 48 thread run). This is one solution to get even faster performance. Other options that MiniBWA gives you is either to use a smaller machine (MiniBWA with 16 cores is faster than BWA MEM with 64 cores), in the event you are getting cloud instances for your task, or to use a larger machine for other concurrent tasks. Or, you don’t have to worry about it much. In every case, MiniBWA is much faster than you would otherwise get.
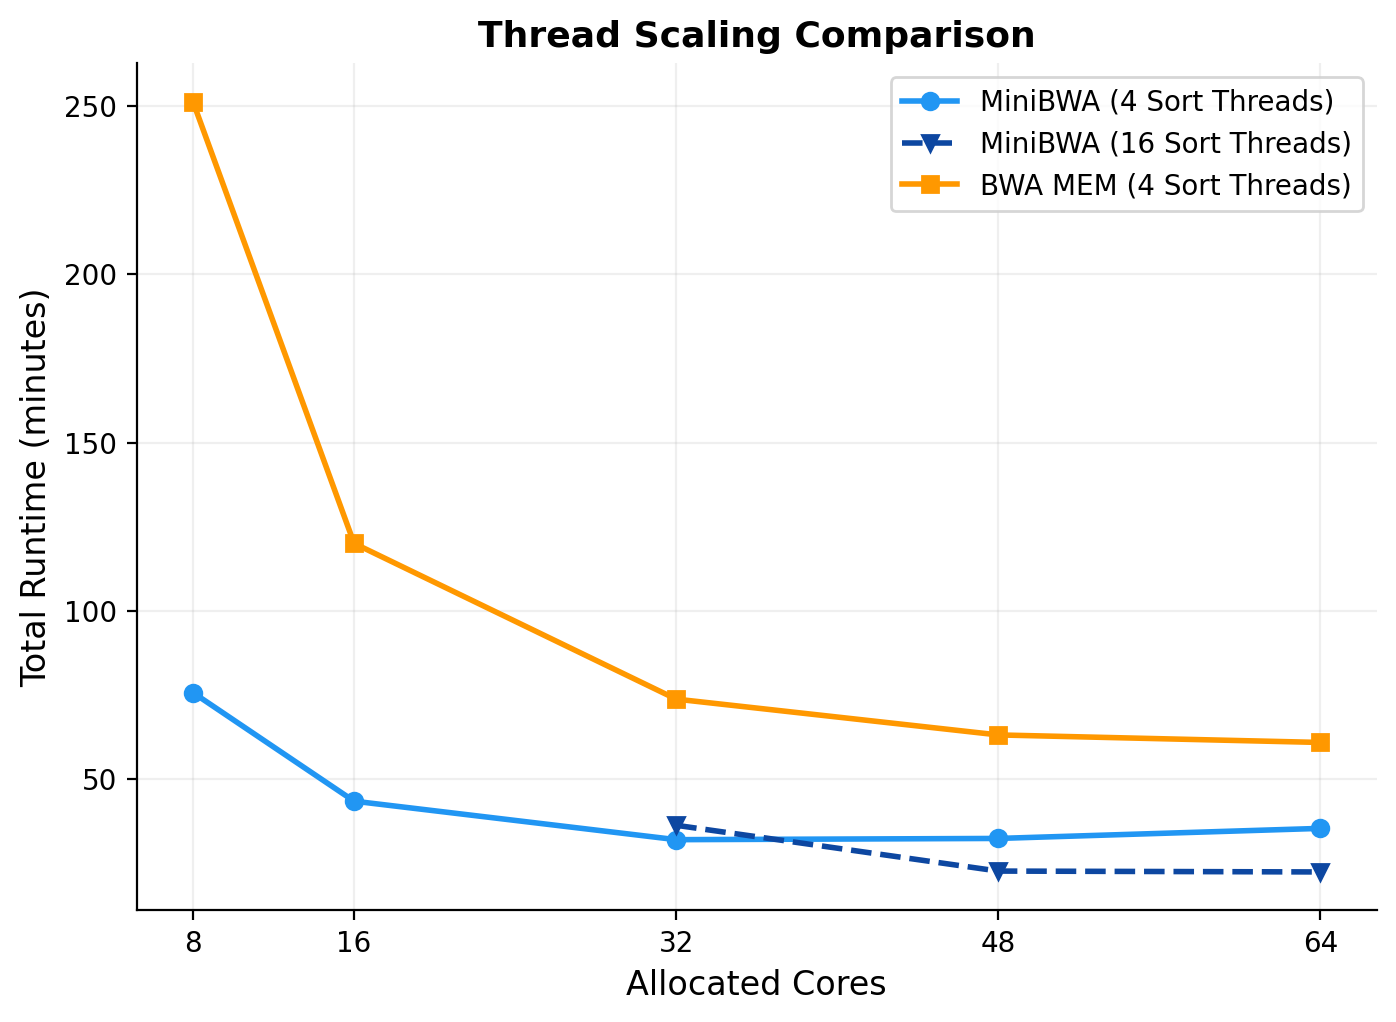
Figure 2. Absolute runtime to process 60x coverage genome sequencing of Oryza sativa with a different level of threads. The solid lines use 4 threads for sorting and the rest for mapping. The dashed line uses 16 threads for sorting and the rest for mapping.
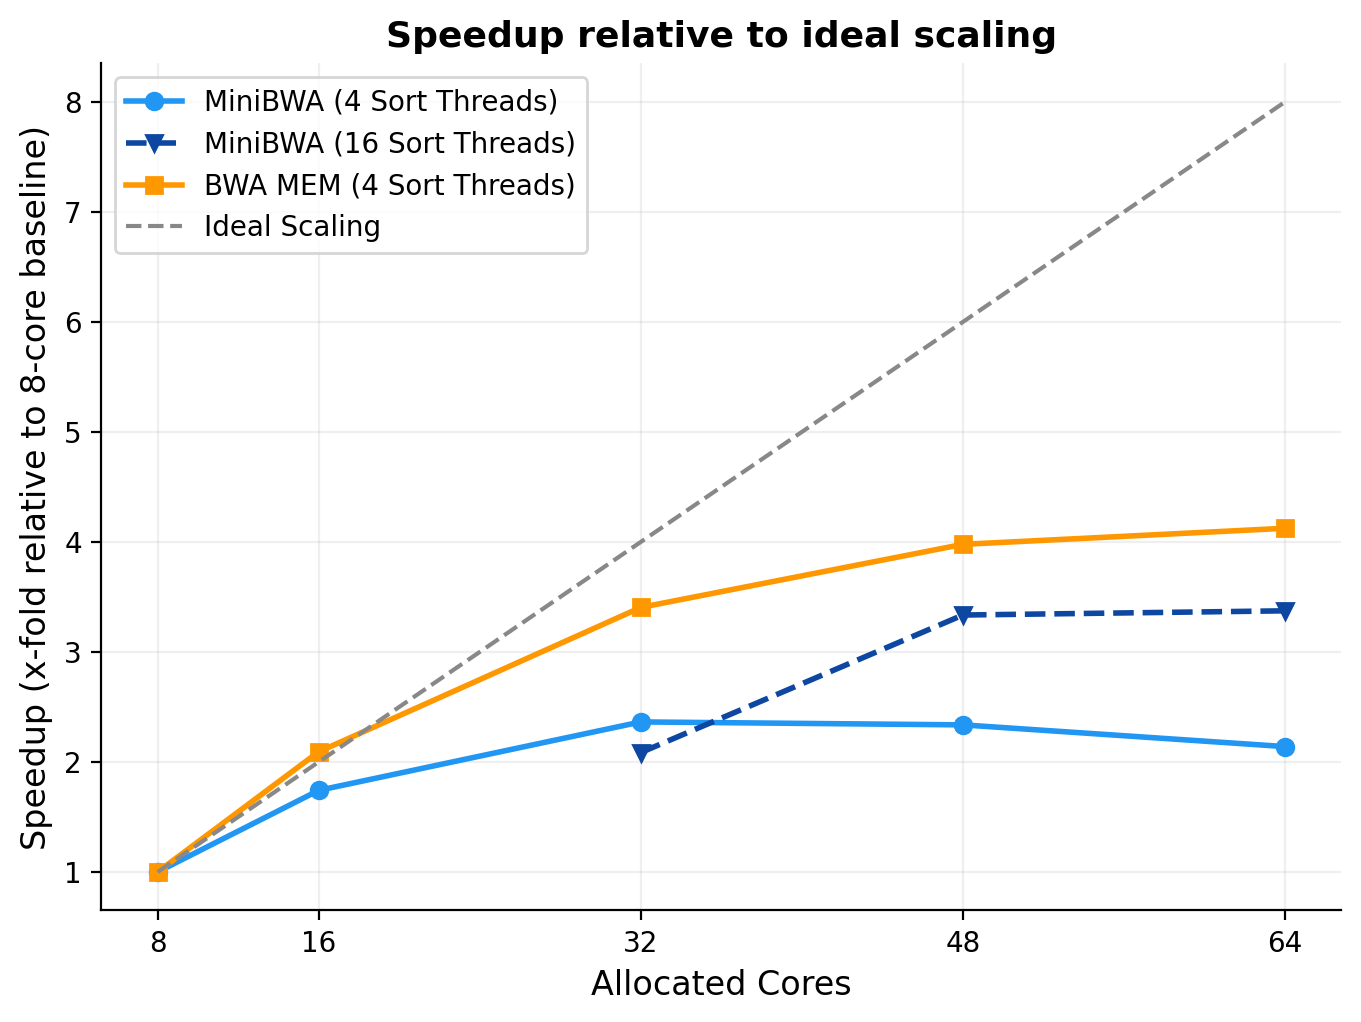
Figure 3. Linear scaling of MiniBWA and BWA MEM with cores relative to the ideal scaling. The line y=x means fully efficient scaling of additional cores to improved runtime.
Assessing Mapping Rates
What about the mappings from BWA MEM versus MiniBWA? In general, they are very highly concordant. On almost all species, MiniBWA is within 0.3% of the total mapping rate of BWA MEM, and specifically tends to be just a bit lower. Overall, you will see that Bowtie2 is a more conservative mapper relative to MiniBWA and BWA MEM. In my observations from talking with users, preference for mapping more aggressively or conservatively is a matter of taste. Some users prefer the conservative mappings of Bowtie2 because this naturally limits downstream analysis to more certain parts of the genome. You can achieve this effect to varying degrees as well in MiniBWA, BWA MEM, or any mapper by filtering on MAPQ values. For this comparison, there is no substitute for knowing very well what you want to get out of your workflow, and having a very good set of evaluations for the problem that you care about.
There are a few species which are extreme outliers for mapping rate, and these can show more of a difference between the two methods. I’ll give more analysis on those in just a bit.
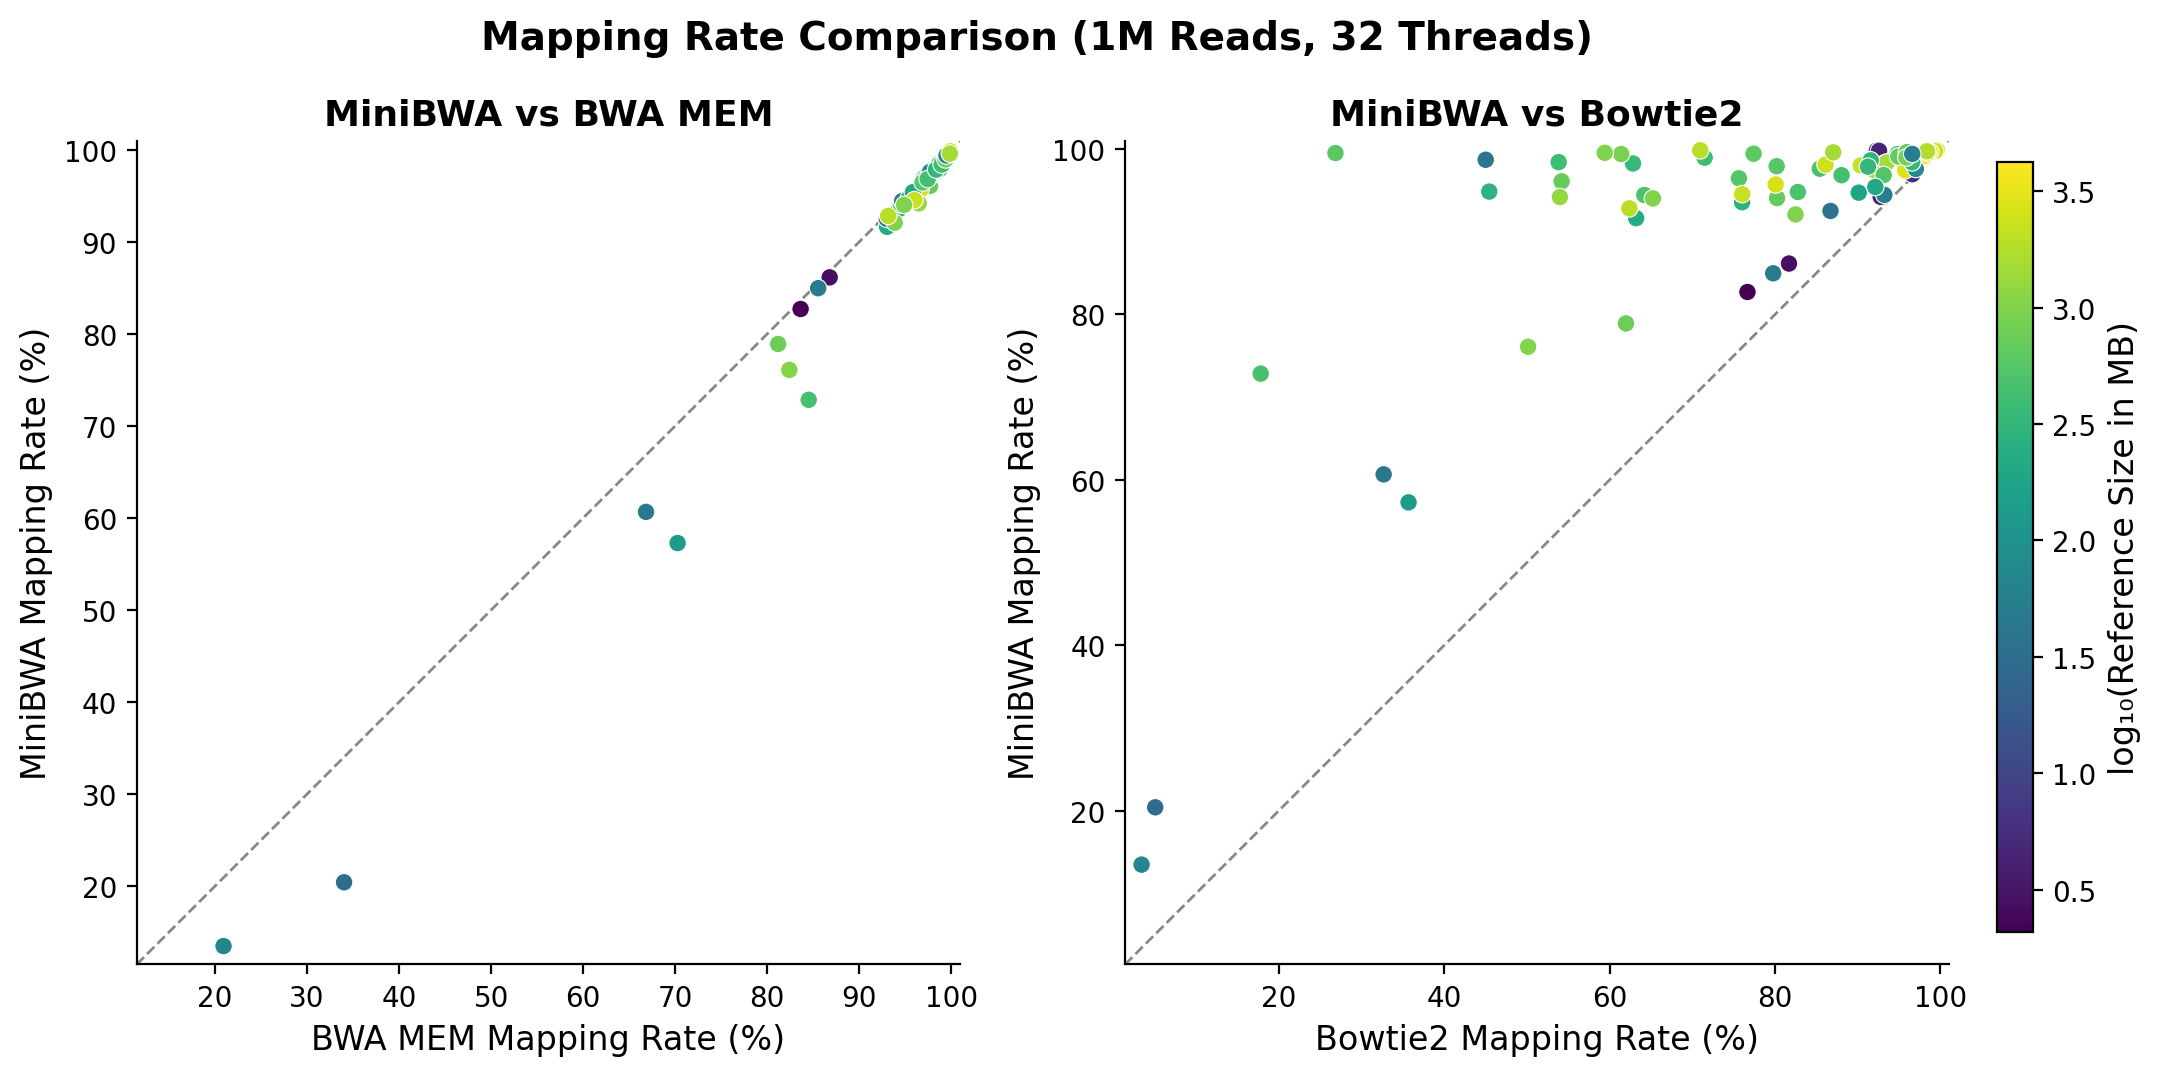
Figure 4. Mapping rates of reads comparing MiniBWA, BWA MEM, and Bowtie2.
Performance on Downstream Tasks
The MiniBWA paper presented benchmarks with the gold standard human HG002 truth set, showing that MiniBWA has fewer errors when used with DeepVariant as compared to BWA + DeepVariant pipelines.
We don’t have a gold standard truth for these species. However, we have PacBio HiFi long reads for the same individuals. Long reads are much more mappable than short reads, and variant calling accuracy is very high. I took 6 species representing the samples that are highly mappable and the outliers. I ran Illumina + MiniBWA and BWA MEM + DeepVariant Illumina models and PacBio + minimap2 + DeepVariant PacBio models. Using the PacBio variant calls as truth, we can look at the precision and recall of the Illumina mappings. Here, I’m going to restrict the analysis to MiniBWA and BWA MEM, as Bowtie2 will be more different as an approach.
There are 4 species which have “normal” mapping rates (>95%): Klebsiella pneumoniae, Rattus norvegicus, Oryza sativa, and Lates calcarifer. There are 2 species which are outliers: Herina lugubris (73% MiniBWA mapping, 85% BWA MEM mapping) and Aureobasidium pullulans (20% MiniBWA mapping, 34% BWA MEM mapping).
As the figure below indicates, in all of the “normal samples”, MiniBWA is either the same as, or slightly better than BWA MEM. This is very consistent with what was reported for humans. In the case of the outliers, The F1 score is very close (favoring MiniBWA on L. calcarifer and BWA MEM on A. pullulans). However, there is a noticeable divergence with MiniBWA favoring precision and BWA MEM favoring recall - that is, MiniBWA is a bit more conservative on these very difficult genomes. Based on my experience with user preference in these situations, I think that most will find the MiniBWA behavior more desirable.
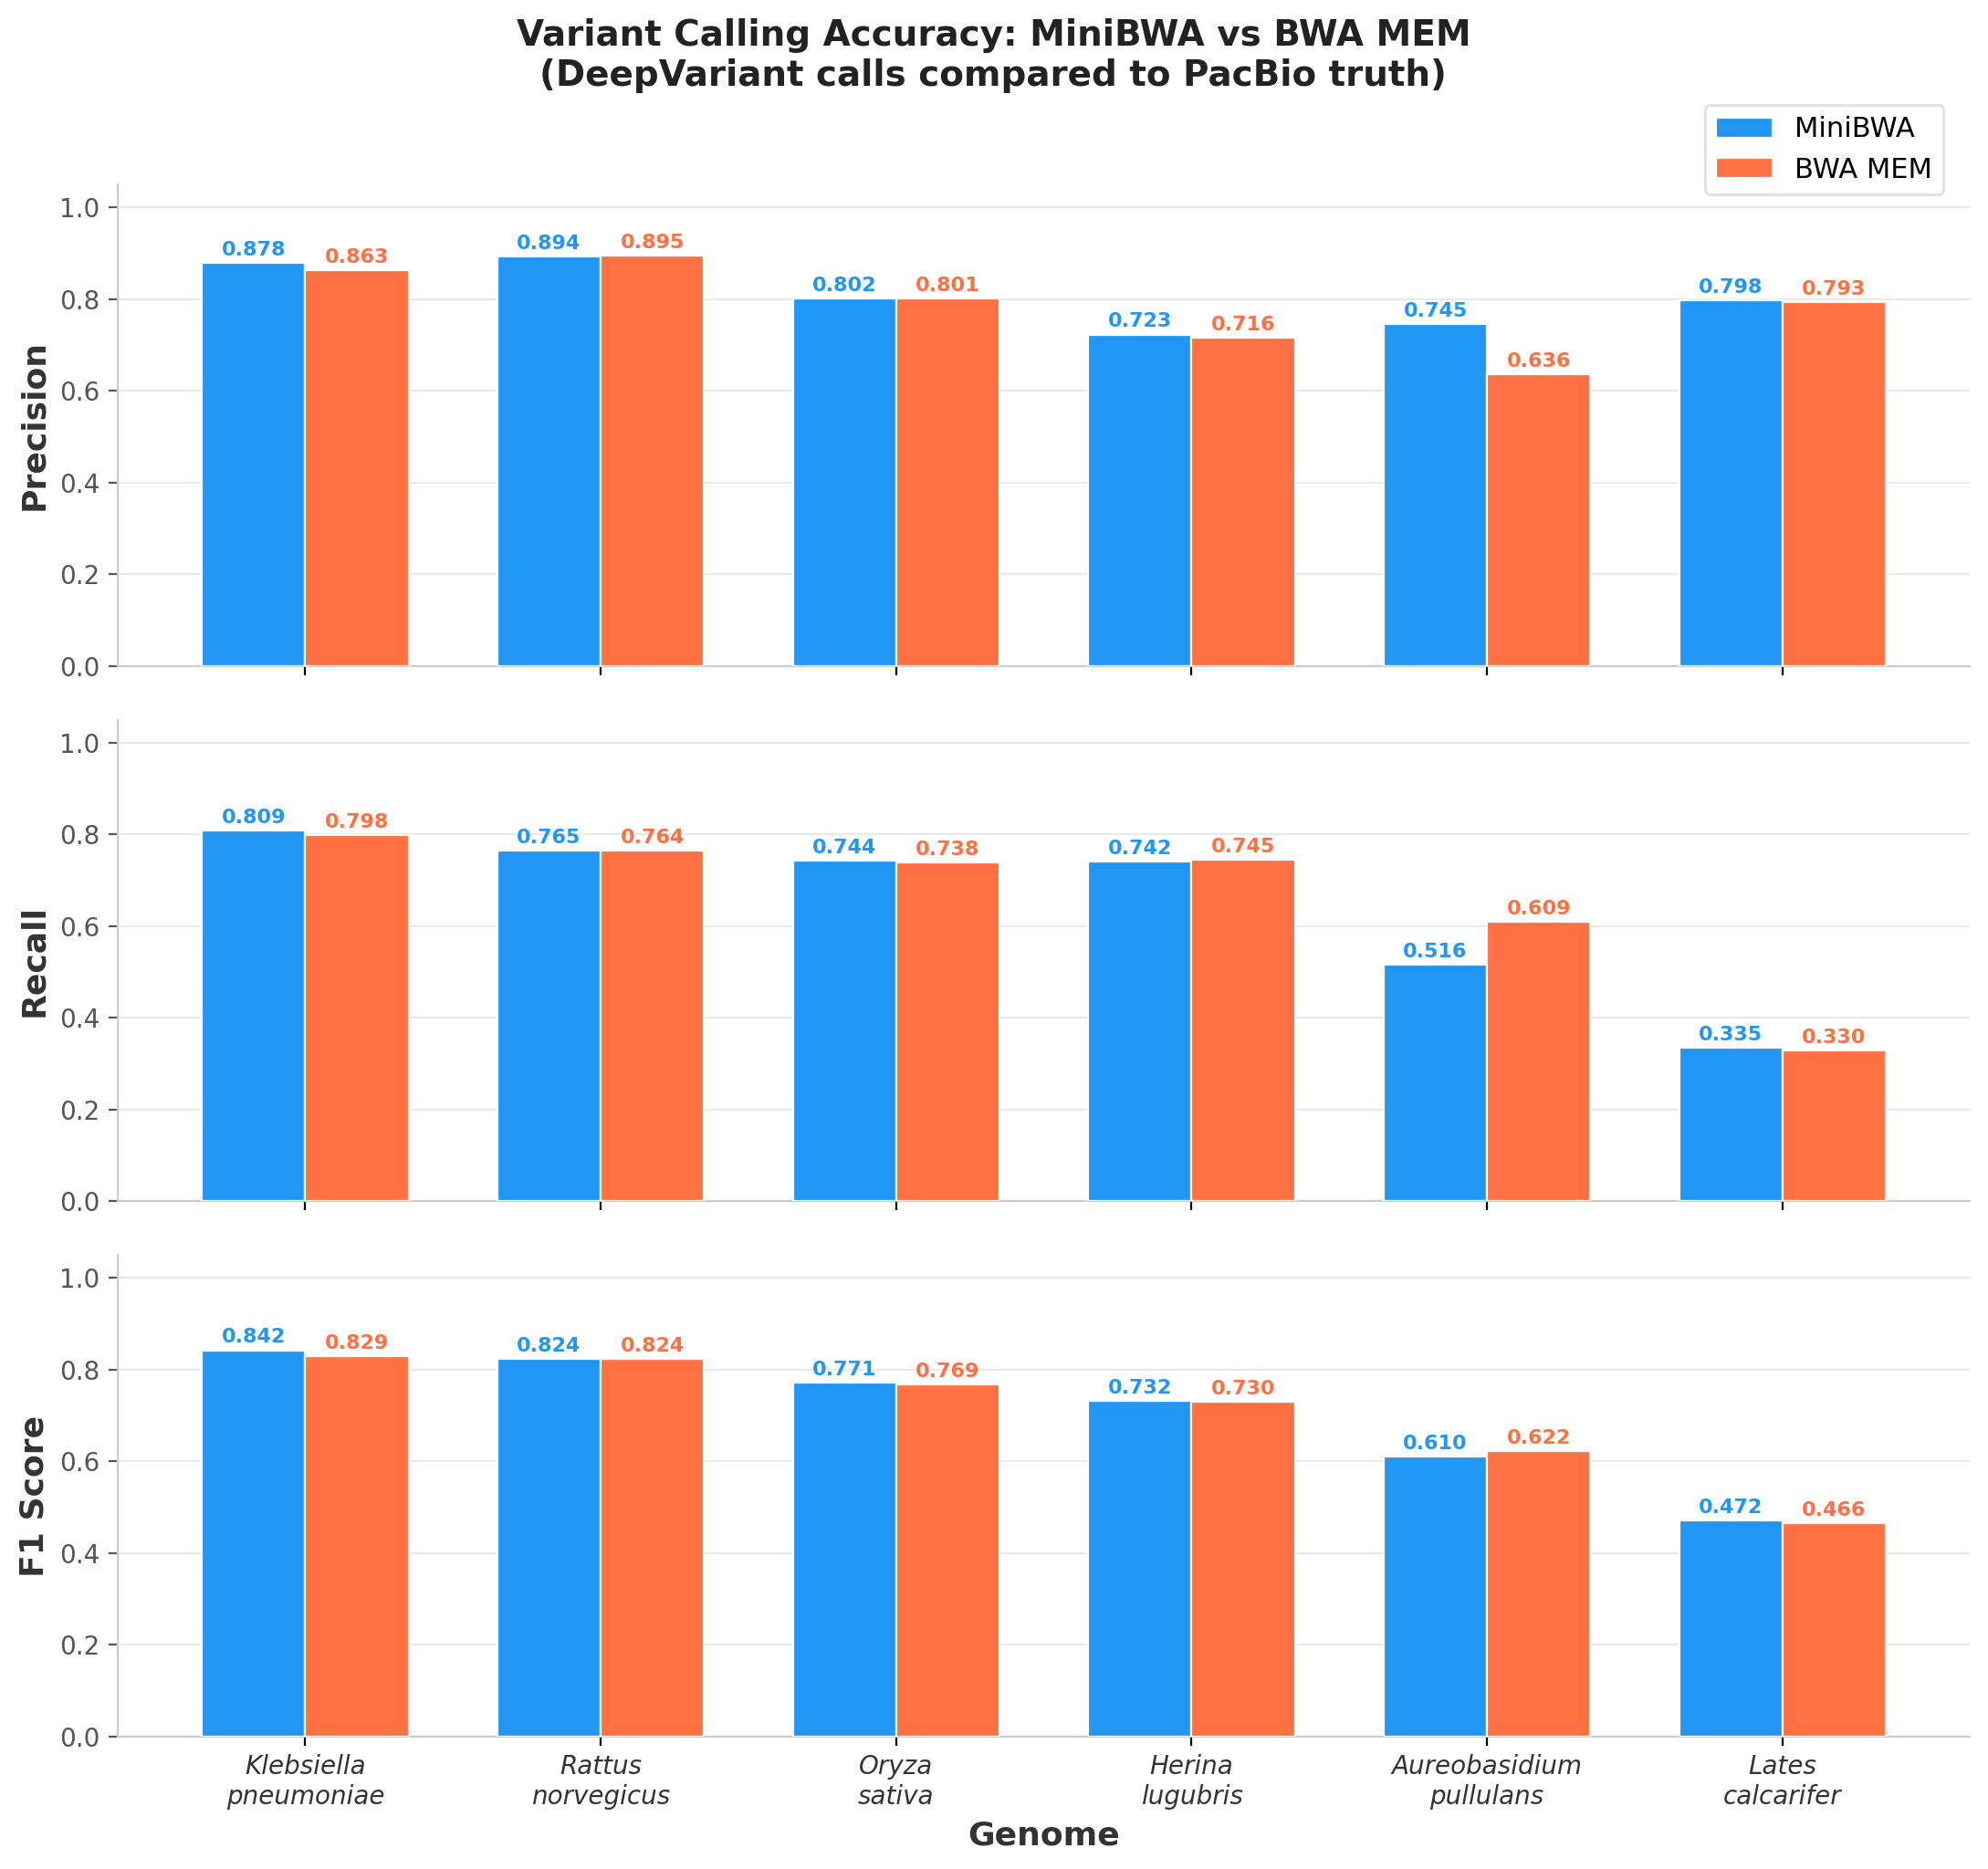
Figure 5. Precision, Recall, and F1 of Illumina variants called by DeepVariant mapped by either MiniBWA or BWA MEM compared against the variants from PacBio sequencing and variant calling using PacBio calls as truth.
Conclusion
I feel I should end a blog with some high level thoughts. But I think the results tell most of the story. I plan to switch to MiniBWA myself.
Finding new methods to try out is always a special joy. Openly sharing evaluations and experience with new methods across the community, to understand what is possible that might not have been before, or areas of caution that might show unexpected behavior is also one of the delightful components of science. I look forward to reading other analyses, especially as there are many things I haven’t had a chance to take a deeper look at.
Appendix: Full Species Data
Throughput is calculated from mapping 1M reads with 32 threads, subtracting index loading time using a paired 100k run. Genome size is the total sequence bases in the reference assembly. Wheat throughput uses direct timing due to cache effects in the subtraction method.
| Species | Genome (Mb) | MiniBWA (M reads/s) | BWA MEM (M reads/s) | Bowtie2 (M reads/s) | MiniBWA Map% | BWA Map% | Bowtie2 Map% |
|---|---|---|---|---|---|---|---|
| Ligilactobacillus salivarius | 2.1 | 0.161 | 0.073 | 0.074 | 82.7 | 83.6 | 76.7 |
| Levilactobacillus brevis | 2.7 | 0.151 | 0.072 | 0.068 | 86.2 | 86.8 | 81.7 |
| Bacillus mojavensis RO-H-1 = KCTC 3706 | 4.0 | 0.190 | 0.088 | 0.085 | 99.8 | 99.9 | 92.3 |
| Bacillus velezensis | 4.2 | 0.199 | 0.079 | 0.088 | 94.2 | 94.5 | 92.8 |
| Bacillus vallismortis | 4.2 | 0.194 | 0.090 | 0.089 | 99.8 | 99.8 | 92.6 |
| Klebsiella pneumoniae | 5.8 | 0.187 | 0.084 | 0.074 | 97.0 | 97.0 | 96.6 |
| Aureobasidium pullulans | 30.3 | 0.245 | 0.071 | 0.106 | 20.4 | 34.0 | 5.1 |
| Pseudogymnoascus destructans | 37.1 | 0.111 | 0.024 | 0.027 | 92.5 | 93.0 | 86.7 |
| Diplodia bulgarica | 40.9 | 0.167 | 0.066 | 0.085 | 98.7 | 98.9 | 45.0 |
| Fusarium oxysporum | 43.7 | 0.192 | 0.051 | 0.089 | 60.7 | 66.8 | 32.7 |
| Rhizopus stolonifer | 48.2 | 0.145 | 0.042 | 0.035 | 99.8 | 99.8 | 98.3 |
| Trypanosoma carassii | 48.5 | 0.130 | 0.036 | 0.037 | 85.0 | 85.5 | 79.8 |
| Fusicolla acetilerea | 50.2 | 0.164 | 0.055 | 0.050 | 97.9 | 98.0 | 95.8 |
| Trypanosoma larimichthysi | 50.4 | 0.152 | 0.049 | 0.045 | 99.4 | 99.5 | 96.6 |
| Morchella sextelata | 53.0 | 0.129 | 0.048 | 0.042 | 94.5 | 94.7 | 93.2 |
| Craspedostauros australis | 65.9 | 0.152 | 0.050 | 0.043 | 98.7 | 98.9 | 96.4 |
| Asterionellopsis glacialis | 66.9 | 0.204 | 0.054 | 0.099 | 13.5 | 20.9 | 3.4 |
| Marssonina zanthoxyli | 80.5 | 0.119 | 0.033 | 0.020 | 97.6 | 97.7 | 97.0 |
| Orius chinensis | 134.8 | 0.121 | 0.033 | 0.092 | 57.3 | 70.3 | 35.7 |
| Plectus sambesii | 186.7 | 0.175 | 0.055 | 0.049 | 98.5 | 98.7 | 96.6 |
| Nematus trochanteratus | 188.1 | 0.119 | 0.035 | 0.042 | 94.7 | 95.4 | 90.1 |
| Neoseiulus longispinosus | 199.2 | 0.148 | 0.039 | 0.048 | 95.4 | 95.8 | 92.1 |
| Paracondylactis sinensis | 210.6 | 0.121 | 0.020 | 0.033 | 99.4 | 99.5 | 96.6 |
| Anopheles gambiae | 216.3 | 0.084 | 0.031 | 0.056 | 91.7 | 93.0 | 63.2 |
| Diprion pini | 268.5 | 0.087 | 0.018 | 0.038 | 93.6 | 94.3 | 76.0 |
| Brachypodium sylvaticum | 271.6 | 0.079 | 0.026 | 0.062 | 94.9 | 96.3 | 45.5 |
| Mechanitis polymnia | 295.9 | 0.119 | 0.031 | 0.039 | 98.6 | 98.9 | 91.6 |
| Rohrbachia minima | 324.7 | 0.142 | 0.038 | 0.043 | 97.9 | 98.4 | 91.2 |
| Rhopalosiphum padi | 338.2 | 0.114 | 0.025 | 0.039 | 98.4 | 98.7 | 96.6 |
| Citrus maxima | 345.1 | 0.079 | 0.022 | 0.036 | 98.3 | 98.7 | 62.8 |
| Coccinella transversoguttata | 376.3 | 0.070 | 0.013 | 0.023 | 99.4 | 99.6 | 94.8 |
| Schizaphis graminum | 380.3 | 0.092 | 0.028 | 0.047 | 98.4 | 99.0 | 53.8 |
| Oryza sativa Indica Group | 393.9 | 0.097 | 0.031 | 0.039 | 99.0 | 99.2 | 71.5 |
| Biston betularia | 404.5 | 0.117 | 0.028 | 0.039 | 99.1 | 99.5 | 96.5 |
| Populus trichocarpa | 423.2 | 0.070 | 0.014 | 0.021 | 96.8 | 97.5 | 88.0 |
| Herina lugubris | 442.8 | 0.048 | 0.013 | 0.070 | 72.8 | 84.5 | 17.8 |
| Enigmonia aenigmatica | 466.0 | 0.092 | 0.024 | 0.031 | 97.6 | 98.4 | 85.4 |
| Daucus carota | 470.1 | 0.058 | 0.010 | 0.023 | 94.8 | 96.0 | 82.8 |
| Argynnis aglaja | 486.8 | 0.052 | 0.014 | 0.031 | 94.5 | 95.8 | 64.2 |
| Macrocystis pyrifera | 528.1 | 0.102 | 0.021 | 0.023 | 96.9 | 97.2 | 93.1 |
| Oxyria digyna | 540.0 | 0.165 | 0.061 | 0.070 | 96.5 | 96.9 | 75.6 |
| Menidia menidia | 571.3 | 0.059 | 0.016 | 0.028 | 97.9 | 98.8 | 80.2 |
| Lates calcarifer | 614.2 | 0.061 | 0.017 | 0.046 | 99.5 | 99.8 | 26.9 |
| Caranx heberi | 618.7 | 0.125 | 0.025 | 0.040 | 99.4 | 99.7 | 77.4 |
| Oresitrophe rupifraga | 662.3 | 0.108 | 0.025 | 0.031 | 99.1 | 99.4 | 94.9 |
| Phoenix dactylifera | 670.5 | 0.098 | 0.022 | 0.029 | 99.6 | 99.9 | 96.0 |
| Geometra papilionaria | 672.7 | 0.077 | 0.019 | 0.026 | 94.1 | 94.5 | 80.2 |
| Acanthopagrus latus | 687.2 | 0.128 | 0.047 | 0.066 | 96.1 | 97.7 | 54.2 |
| Elasmostethus interstinctus | 752.3 | 0.065 | 0.017 | 0.039 | 78.9 | 81.2 | 62.0 |
| Stichopus monotuberculatus | 833.8 | 0.134 | 0.030 | 0.037 | 99.0 | 99.4 | 95.9 |
| Phoxinus grumi | 900.4 | 0.133 | 0.047 | 0.064 | 99.4 | 99.5 | 61.4 |
| Sialia sialis | 958.5 | 0.136 | 0.038 | 0.065 | 92.1 | 93.9 | 82.5 |
| Pterocryptis cochinchinensis | 984.0 | 0.048 | 0.013 | 0.029 | 99.5 | 99.7 | 59.4 |
| Reticulitermes chinensis | 993.2 | 0.084 | 0.022 | 0.036 | 94.0 | 94.9 | 65.2 |
| Cylicomorpha solmsii | 1000.0 | 0.173 | 0.051 | 0.105 | 76.1 | 82.4 | 50.1 |
| Oedemera lurida | 1225.3 | 0.027 | 0.009 | 0.022 | 94.2 | 96.5 | 54.0 |
| Hishimonus sellatus | 1379.8 | 0.060 | 0.015 | 0.015 | 97.5 | 97.9 | 91.9 |
| Zingiber officinale | 1487.0 | 0.057 | 0.021 | 0.030 | 99.6 | 99.9 | 87.0 |
| Holothuria leucospilota | 1502.7 | 0.083 | 0.022 | 0.023 | 98.4 | 99.0 | 93.5 |
| Sinocyclocheilus jii | 1750.3 | 0.113 | 0.022 | 0.025 | 99.7 | 99.8 | 98.4 |
| Sinocyclocheilus longicornus | 1822.1 | 0.054 | 0.014 | 0.024 | 99.8 | 99.9 | 71.0 |
| Sinocyclocheilus bicornutus | 1879.7 | 0.018 | 0.002 | 0.026 | 92.8 | 93.2 | 62.4 |
| Magnolia longipedunculata | 2160.9 | 0.043 | 0.013 | 0.017 | 98.0 | 98.4 | 90.4 |
| Pisaura mirabilis | 2168.8 | 0.067 | 0.015 | 0.031 | 94.5 | 96.0 | 76.0 |
| Alexandromys fortis | 2277.7 | 0.156 | 0.036 | 0.045 | 97.3 | 98.0 | 96.5 |
| Gossypium hirsutum | 2278.2 | 0.107 | 0.022 | 0.019 | 99.8 | 99.8 | 99.4 |
| Orobanche hederae | 2355.8 | 0.049 | 0.009 | 0.017 | 98.1 | 98.5 | 86.1 |
| Cercodemas anceps | 2409.6 | 0.063 | 0.012 | 0.017 | 99.0 | 99.3 | 95.5 |
| Equus kiang | 2487.2 | 0.143 | 0.028 | 0.040 | 99.9 | 99.9 | 99.6 |
| Capra hircus | 2511.8 | 0.078 | 0.022 | 0.029 | 98.3 | 98.6 | 93.2 |
| Myodes glareolus | 2539.5 | 0.067 | 0.015 | 0.021 | 95.7 | 96.7 | 80.1 |
| Lepus yarkandensis | 2695.4 | 0.086 | 0.017 | 0.024 | 97.4 | 97.8 | 95.7 |
| Rattus norvegicus | 2845.9 | 0.124 | 0.024 | 0.025 | 99.5 | 99.8 | 98.5 |
| Hydropotes inermis | 3450.4 | 0.042 | 0.005 | 0.005 | 99.7 | 99.7 | 98.8 |
| Fontitrygon garouaensis | 4165.0 | 0.093 | 0.016 | 0.020 | 99.2 | 99.3 | 98.2 |
| Triticum aestivum (wheat) | 14577.4 | 0.053 | 0.020 | 0.028 | 99.3 | 99.6 | 96.6 |